Pacific Ocean (2002-2016)

Please click on the month you are interested in.


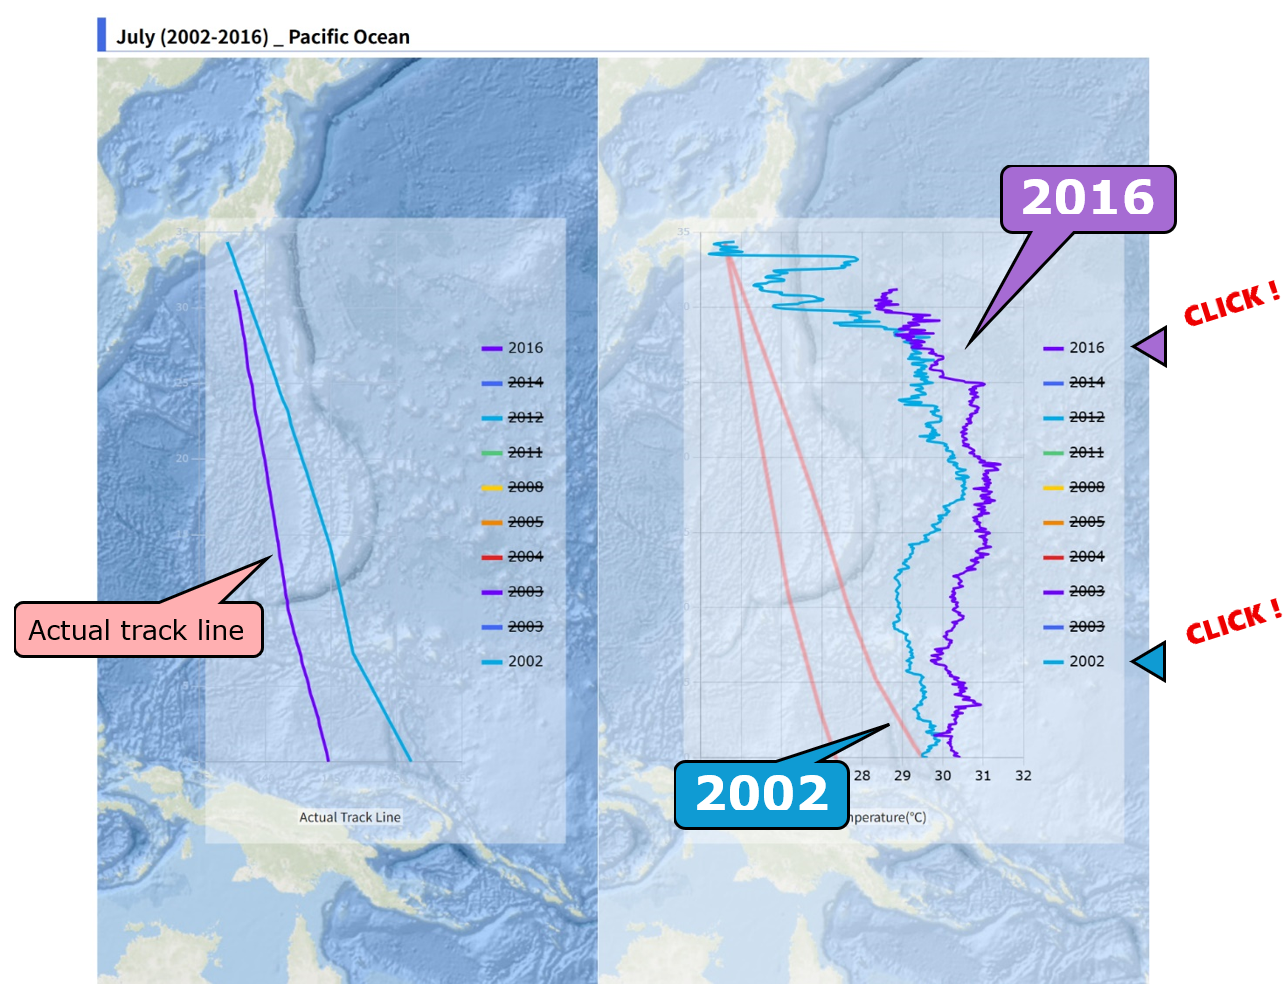
How to read the graph : 1. Check the change in water temperature

You can check the changes in water temperature year by year.


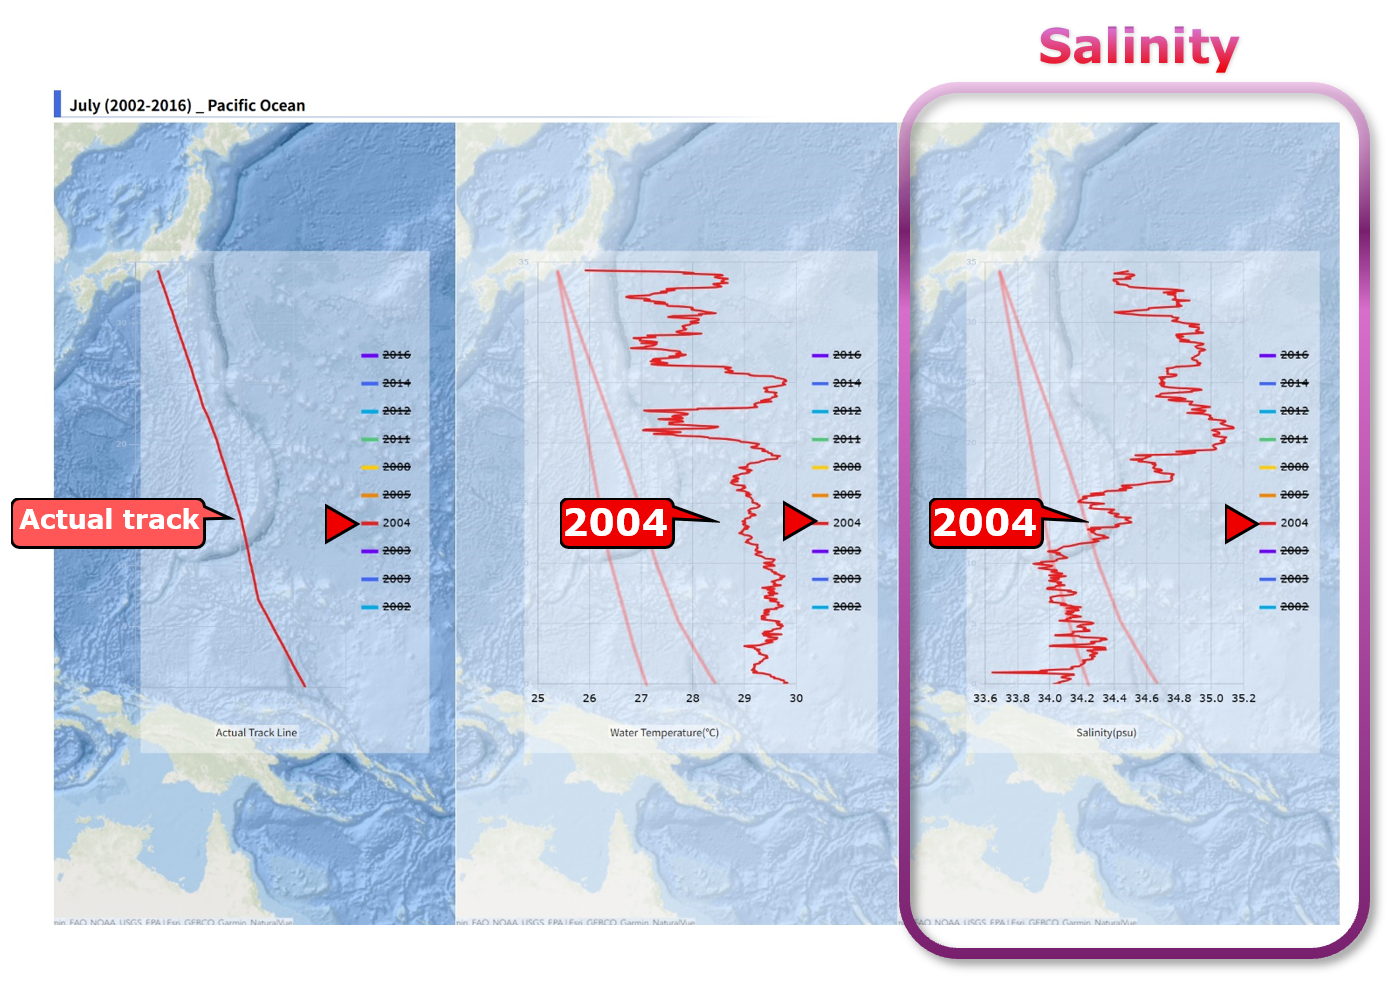
How to read the graph : 2. Check the Salinity

You can check the salinity for each year.

Additional information

Information
  • You can check the monitoring report on Pacific Ocean salinity released in 2015.
  • Ships in the Japan-Australia sea area are coal carriers that mainly transport thermal coal from the east coast of Australia and East Kalimantan, Indonesia. This data has been collected with the cooperation of many stakeholders, including shippers, operators, shipowners, crew members of the Japan-Australia sea area ships, and shipping agents.
Gratitude
  • This site's graphs are created using the external program Chart.js.
  • The ship's route confirmation and map images on this site utilize the services of GPS Visualizer.